
Search for articles or browse our knowledge portal by topic.
Designing for Speed Transition Zones

Roadway Context – The physical, social, and land-use setting surrounding a roadway that influences its design and operation.
Speed Transition Zone – A segment of roadway designed to help drivers safely and comfortably adjust from a higher-speed environment to a lower-speed environment (or vice versa). It serves as a buffer between two different roadway contexts—most often between rural and rural town or suburban areas.
Perception-Reaction Area – The upstream portion of the speed transition zone where the driver perceives a change in roadway context, recognizes that a different speed is expected, and begins deciding how to respond.
Deceleration Area – The downstream portion of the speed transition zone where the driver slows their vehicle to reach a lower target or operating speed.
Roadway contexts differ significantly in their land development patterns and types of travel supported. With sparse land development and sporadic access points, rural roadways enable high-speed, long-distance travel. Conversely, rural towns, suburban, and urban contexts have denser land development. Their roadways often have more traffic control, many access points, on-street parking, curbs, gutters, sidewalks, and lower design speeds. Pedestrians and micromobility users rely on these facilities for travel as well. Because rural and other roadway contexts differ in their operations and configurations, motorists benefit from design features and visual cues that help them recognize when they are entering a new context that requires a reduction in speed.
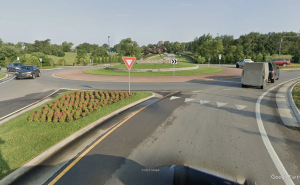
Speed transition zones, which are located on the borders of rural and rural town or rural and suburban roadway contexts, incorporate design features that encourage motorists to slow down as they enter more developed communities. (Figure 1). These features minimize conflicts with other roadway users and improve safety. AASHTO’s Green Book divides transition zones into a perception-reaction area and a deceleration area. Table 1 compares the major characteristics of rural, transition, and community zones. Community zones encompass rural town, suburban, or urban roadway contexts. Except for speed, the table does not specify quantitative thresholds to distinguish one context from another. For additional information on identifying different roadway contexts see the HKP article Understanding Functional Classification and Context Classification.

Figure 1 Speed Transition Zone
| Table 1 Characteristics of Rural, Transition, and Community Zones | ||||
|---|---|---|---|---|
| Rural Zone | Transition Zone | Community Zone | ||
| Perception-Reaction Area | Deceleration Area | |||
| Design Speed | ≥ 45 mph | ≥ 45 mph | Varies (Decreases entering community zone) | ≤ 35 mph |
| ADT | Lower | Lower | Increasing | Higher |
| Access Density | Low | Low | Medium | High |
| Pedestrian/ Bike Activity | Low | Low | Medium | High |
| Land Use | Rural/Low Density | Rural/Low Density | Increasing Density and Intensity | Higher Density and Intensity |
| On-Street Parking | No | No | Unlikely | Possibly |
Source: NCHRP Report 737, Table 4-1
The perception-reaction area is the portion of the speed transition zone closest to the rural area. Design treatments used along these segments should warn motorists of downstream changes in the roadway environment (e.g., signs, pavement markings). The deceleration area lies between the perception-reaction area and community zone. The purpose of this segment is to give motorists an area in which they can reduce their speed to the target speed. Physical speed management treatments (e.g., center islands, roundabouts) are appropriate for this area. Section 4 reviews design strategies suited for each area of a transition zone.
Two factors influence selection of speed transition zone length: (1) 85th percentile vehicle speed in the rural zone and (2) community zone target speed. Table 2 lists minimum recommended lengths for speed transition zones, including lengths for perception-reaction areas and deceleration areas. For example, if the rural roadway speed is 50 mph and the community zone target speed is 30 mph, the minimum lengths for the perception-reaction area and the deceleration area are 190 ft. and 380 ft., respectively. This results in a total transition zone length of at least 570 ft.
Values listed in Table 2 assume a perception-reaction time in the rural zone of 2.5 seconds. In areas with limited sight distance or grades steeper than 3%, transition zones may need to be longer than distances indicated in Table 2.
| Table 2 Recommended Minimum Lengths for Speed Transition Zones | |||||||
|---|---|---|---|---|---|---|---|
| Rural Zone Speed | |||||||
| 45 mph | 50 mph | 55 mph | 60 mph | 65 mph | |||
| Community Zone Target Speed | 20 mph | PR | 170 | 190 | 210 | 230 | 240 |
| D | 385 | 450 | 510 | 595 | 680 | ||
| TOT | 555 | 640 | 720 | 825 | 920 | ||
| 25 mph | PR | 170 | 190 | 210 | 230 | 240 | |
| D | 345 | 415 | 480 | 565 | 655 | ||
| TOT | 515 | 605 | 690 | 795 | 895 | ||
| 30 mph | PR | 170 | 190 | 210 | 230 | 240 | |
| D | 305 | 380 | 440 | 520 | 600 | ||
| TOT | 475 | 570 | 650 | 750 | 840 | ||
| 35 mph | PR | 170 | 190 | 210 | 230 | 240 | |
| D | 255 | 330 | 400 | 485 | 570 | ||
| TOT | 425 | 520 | 610 | 715 | 810 | ||
| 40 mph | PR | — | 190 | 210 | 230 | 240 | |
| D | — | 270 | 340 | 425 | 510 | ||
| TOT | — | 460 | 550 | 655 | 750 | ||
| 45 mph | PR | — | — | 210 | 230 | 240 | |
| D | — | — | 265 | 365 | 465 | ||
| TOT | — | — | 475 | 595 | 705 | ||
| PR | Perception-Reaction Distance (ft) | ||||||
| D | Deceleration Distance (ft) | ||||||
| TOT | Total Distance Required (ft) | ||||||
Source: Derived from AASHTO Green Book and NCHRP Report 737
After traveling in rural areas with high speed limits, many motorists approaching community zones with lower speed limits do not perceive their speed accurately and fail to slow down enough. AASHTO’s Green Book notes that transition zones should incorporate a combination of warning treatments and physical treatments.
Designs for perception-reaction areas should emphasize warning treatments, not physical treatments. Placing warning treatments upstream of physical treatments lets motorists perceive downstream changes in a roadway’s configuration and adjust their behaviors accordingly. If warning treatments do not precede physical treatments, motorists may approach the physical treatments at an excessively high speed.
Warning treatments include enhanced signing, optical speed bars, variable message signs, supplemental in-lane pavement markings, and transverse pavement markings. Physical treatments produce more conspicuous changes in the roadway environment. Examples include center islands, roundabouts, chicanes, raised medians, lane narrowing, roadway reconfiguration, and the application of horizontal deflection through the installation of gradual curvature. Another option to reduce speeds and improve safety is prohibiting passing through speed transition zones. Table 3 provides details on four common physical treatments.
| Table 3 Physical Treatments for Speed Transition Zones | ||
|---|---|---|
| Treatment | Notes | |
| Center Island |
 |
|
| Roundabout |
 |
|
| Horizontal Deflection |
 |
|
| Chicanes and Raised Medians |
 |
|
While deceleration areas should prioritize the use of physical treatments because they are more effective at reducing speeds, incorporating warning treatments in these portions of speed transition zones reinforces the need for drivers to slow down. AASHTO’s Green Book and NCHRP Report 737 recommend combining multiple treatments throughout speed transition zones. Designers around the world have found that using multiple treatments is more effective than relying on single treatment. For example, in rural Europe, transportation agencies have implemented multiple speed management strategies (e.g., lane narrowing, signage, landscaping) in transition zones so motorists slow down as they enter towns.
When choosing treatments, consider the project context to determine which design strategies are most likely to produce the targeted reductions in speed. The SSA Toolbox (coming soon) includes guidance on applying speed management treatments. It is not just the combination of treatments that matter. Sequencing is equally important for influencing motorist behavior. For instance, gateway treatments can encourage motorists to slow down as they enter communities. But other treatments (e.g., landscaping elements, chicanes, horizontal and vertical deflection) should be incorporated downstream of the gateway to remind motorists of the surrounding context and the importance of maintaining safe speeds. Proper sequencing reinforces speed compliance by actively shaping driver expectations.
KYTC Highway Design Manual. https://transportation.ky.gov/Organizational-Resources/Policy%20Manuals%20Library/Highway%20Design.pdf
KYTC Complete Streets, Roads, and Highways Manual. Section 4.4. https://transportation.ky.gov/BikeWalk/Documents/Complete%20Streets,%20Roads,%20and%20Highways%20Manual.pdf
AASHTO Green Book
- Section 7.2.19 discusses speed transition zones entering rural towns and provide design guidance.
Impact of the New Context Functional Classifications for KYTC
- Appendix J of this KTC report includes examples of designing for transitions between contexts.
NCHRP Report 737 Design Guidance for High-Speed to Low-Speed Transition Zones for Rural Highways
- Chapter 4 provides in-depth design guidance, including step-by-step methods for analyzing transition zones and selecting appropriate treatments. A catalog of transition zone treatments describes different treatments and includes information on effectiveness, cost, and installation locations.
NCHRP Report 1148 Human Factors Guidelines for Road Systems (Third Edition)
- Chapter 9 reviews design strategies for rural-urban transition and discusses underlying justifications for adopting different measures.
HKP article Understanding Functional Classification and Context Classification
- Section 3 includes descriptions of the five roadway contexts.