Search for articles or browse our knowledge portal by topic.
Intersection Control Evaluation (ICE) Guidance
Intersection control evaluation (ICE) is a data–driven, performance–based framework used to screen intersection alternatives and identify an optimal solution.
1.1 Benefits of ICE
Benefits of using ICE include:
- Implementation of solutions that are safer, more balanced, and more cost–effective
- Consistent documentation to support transparent decision making
- Increased awareness of innovative solutions
- Objective performance metrics for decision making
1.2 Types of Alternative or Innovative Intersections and Interchanges
Several types of innovative intersections and interchanges are in use across the United States. Experience with innovative designs suggests significantly greater safety and operational benefits can be realized at a system level if they are used more broadly. Table 1 lists examples of innovative intersections and interchanges.
| Table 1: Innovative Intersection and Interchange Examples | |
|---|---|
| Intersections | Interchanges |
| Restricted Crossing U-Turn (RCUT) | Single-Point Urban Interchange |
| Roundabout | |
| Mini Roundabout | Diverging Diamond Interchange (DDI) |
| Continuous Green-T | |
| Quadrant Roadway | Double Roundabout |
| Displaced Left Turn | |
| Median U-Turn (MUT) | |
| Bowtie | |
| Single Loop | |
For more information and resources see KYTC’s SAFERoad Solutions website. The Virginia DOT’s Innovative Intersections and Interchanges website also provides detailed information on innovative intersections, appropriate use cases, and illustrated guidance. For locations of existing innovative intersection operating in Kentucky, see the Cabinet’s Alternative Intersections Map.
An ICE should be completed for all intersections — including newly created intersections — on a project if one or more of the intersecting roadways is on the state-maintained roadway system. An ICE is not needed if proposed work will not substantively change an intersection (e.g., a project limited only to mill-and-fill pavement resurfacing with no modifications to intersection geometry or control). An ICE may not be needed if actual traffic counts are available for all intersecting roadways and all the following conditions are met:
- EEC KAB < 0 and the EEC CO < 0
- Intersection Excess Expected Crashes (EECs) are found on the Advanced Map of the Crash Data Analysis Tool [CDAT]. KABCO are injury level severities recorded on crash reports.
- No notable crash patterns
- Minor road AADT < 400
- No known operational issues
When intersecting roadways lack traffic counts (e.g., county roads), the intersection may be excluded from ICE if all the following conditions are met:
- No notable crash patterns
- Minor road does not serve many users
- No known operational issues
These criteria also apply to intersections at interchange terminals.
If an intersection is excluded from the ICE process, document the justification in the Design Executive Summary (DES). RCUTs should still be considered when a lower volume route intersects with a median-divided highway.
The Project Manager (PM) and the Project Development Team (PDT) may apply ICE to interchange projects where interchange geometry (e.g., diamond, DDI, SPUI) is being modified or a new interchange is proposed. Applying ICE on projects involving changes to interchange geometry is optional.
The ICE process runs parallel to other project development activities:
- Stage 1 of the ICE process (screening of potential intersections) occurs as early as possible in project development (e.g., planning or conceptual design phase). Stage 1 findings are used to select alternatives that merit further evaluation during preliminary design.
- Stage 2 (intersection selection) is completed at the end of preliminary design.

ICE is scalable. This means the level of effort put into screening and analysis should be commensurate with the magnitude and nature of the project — less effort for simple projects, more effort for complex ones.
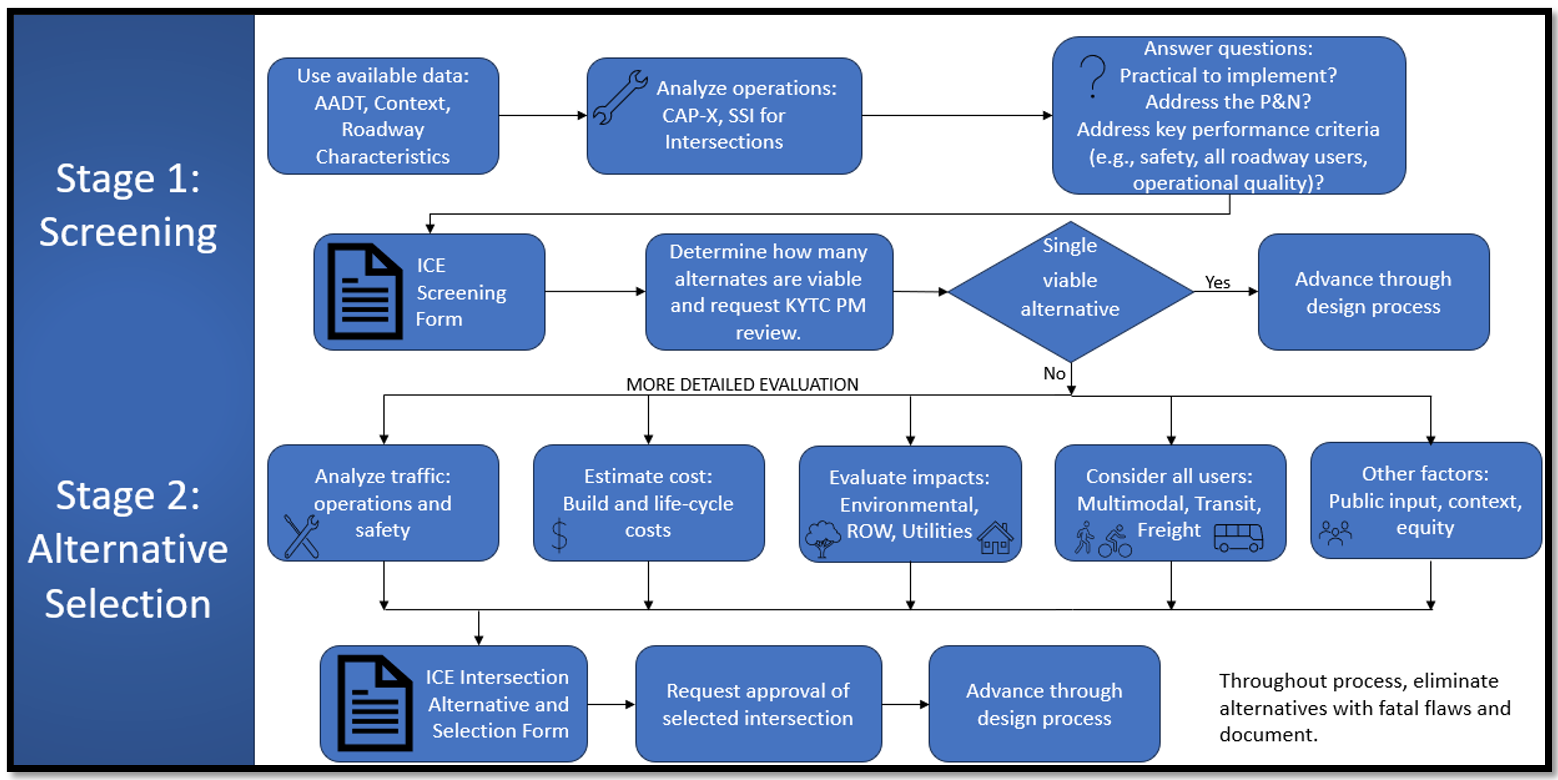
There are two stages. Stage 1 is the screening process used to shortlist possible alternatives that merit further consideration and analysis because they meet organizational goals, project needs and are practical. Stage 2 is the intersection selection stage where alternatives are evaluated in more detail and objectively compared to other alternatives. Figure 1 displays a flowchart of the ICE Process.
Figure 1 KYTC ICE Process Flowchart
3.1 Stage 1 – Screening
Screening eliminates non-competitive options and shortlists intersection alternatives. This screening occurs at a high level. The Project Development Team (PDT) should screen all feasible and reasonable alternatives. More in-depth analysis is needed for alternatives that progress to Stage 2.
Answer the following questions during screening:
- Is the intersection alternative practical to implement (based on construction and operating costs, potential environmental impact, and footprint)?
- Does the alternative meet the transportation purpose and need?
- Does the alternative address key system performance criteria (e.g., safety, all roadway users, operational quality)? Consider the context classification, land use, and likely travel needs at the intersection.
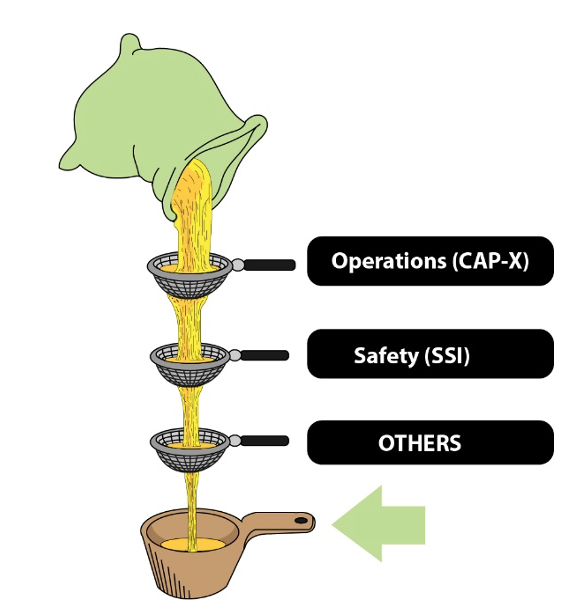
In addition, the analysis used to screen feasible intersection alternatives requires the application of spreadsheet tools developed for or updated in coordination with NCHRP Report 1087 (A Guide for Intersection Control):
- Capacity Analysis for Planning of Junctions (CAP-X). CAP-X is an operational analysis tool to evaluate selected types of intersection and interchange designs.
- SSI Score Calculator The SSI tool is used for safety assessments of intersections and interchanges.
The tools include several defaults that can be overridden with project specific data if the project team agrees, and the data is available.
| Table 2: Tools Used in the ICE Screening Process | |
|---|---|
| Tool | Purpose |
| Capacity Analysis for Planning of Junctions (CAP-X)* | An operational analysis tool based on critical lane volumes that is used to evaluate selected types of intersection and interchange designs. Provides safety assessment scores for pedestrian and bicycle accommodations. |
| SSI Score Calculator Tool* | Used for the motor vehicle safety assessment of intersections based on Safe System principles – removing or reducing the number of higher-angle crashes and conflict points and reducing vehicle speeds and exposure. |
*The CAP-X and SSI Score Calculator Tools may be downloaded from National Academies website.
Note: The recommended spreadsheet tools provide very high-level screenings. They were developed to require minimal inputs, and to apply to traditional and alternative intersection types. The spreadsheets may not address some details of the intersection operation. If the PDT is concerned the software is prematurely screening out feasible alternatives, the alternatives should advance to Stage 2 for a more detailed analysis.
3.1.1 Data Needs
Data required to use the capacity and safety screening tools include:
- Traffic volumes (veh/hr) including turning movements
- % Heavy vehicles
- Growth % (optional) to project volumes for a future year if forecasted numbers are unavailable.
- Feasible alternative intersection for analysis
- Existing intersection type (if applicable)
- Facility type
- Major and minor road AADT
- Number of thru lanes at each approach
- Number of turn lanes at each approach
- Posted speeds
- Crosswalk markings
If collision data for the existing intersection is available, it should be reviewed, but is not needed for the screening tools. Collision data for intersections is available through CDAT.
3.1.2 Capacity and Safety Screening
Typically, CAP-X is used first, then the SSI Score Calculator. The spreadsheets include instructions and several default values. The PM and the PDT may consider using other values if they are available and applicable to the intersection. Below are some helpful tips for using the CAP-X and SSI tools.
CAP-X Entry Tips
- The CAP-X default for heavy vehicle percentage is 2%. Truck percentages are available for most state-maintained roads in the KYTC Traffic Count Reporting System. Enter the most recent reported truck percentages. The Highway Capacity Manual (HCM) includes single-unit trucks and tractor trailers as heavy vehicles.
- Volume growth percentages can be used if projecting to a design year. If the project has a completed traffic forecast, input the reported growth percentage. Smaller-scale projects may use a growth percentage agreed upon by the PDT. Note: Be cautious when screening alternatives based on projected traffic volumes for a design year many (e.g., 20) years into the future. Overbuilding an intersection based on traffic growth rates that may or may not occur could adversely affect intersection safety.
- In the Alternative Selection section, select yes only for alternatives that are reasonable given the project context.

SSI Entry Tip
- Required inputs are minimal. In the Inputs tab follow instructions for optional input values. If available, enter peak hour traffic counts into the appropriate orange cells.
3.1.3 Screen Documentation
For each intersection, submit screening results on the ICE Screening Form with attachments (e.g., CAP-X and SSI files, crash data) for the KYTC PM to review. CAP-X results include high-level operational results for all legs of each intersection alternative. Consider this information alongside the operational results for the entire intersection reported on the form.
The PM, with input from the PDT, chooses intersection control alternatives from the screening process that will move forward to Stage 2. If a single viable intersection control strategy is identified through the screening process, include a justification on the ICE Screening Form and advance the alternative through the design process.
3.2 Stage 2 – Intersection Alternative Selection
During Stage 2, alternatives that made it through Stage 1 screening are evaluated in more detail and compared to other alternatives. Table 3 describes the recommended analysis and other factors to consider in intersection control selection.
| Table 3 ICE Stage 2 Analysis and Evaluation Factors | |
|---|---|
| Intersection Control Evaluation Factors | Recommended Tools & Resources |
Operational Analysis
|
Traffic Analysis Software (HCM Methodology)/ PPEAG Tool* |
| KYTC’s Microsimulation Guidelines | |
Motor Vehicle Safety Performance
|
SPICE* |
Context and Equity
|
KYTC Stage 1 ICE Form/ Environmental Justice Study (if available). |
Pedestrian and Bicyclist Safety Assessment
|
CAP-X Multimodal Sheets*/ Design Flags Tool* |
Environmental, Utility, Right-of-Way Impacts
|
Preliminary project plans/ environmental document |
Public Input
|
Public meeting notes |
Intersection Costs
|
KYTC preliminary cost estimate data/ LCCET* |
*The spreadsheet tool may be downloaded from National Academies website.
Typically, this information should be available to the PM and the PDT during the Preliminary Line and Grade meeting for consideration resulting in the selection of an intersection control alternative.
3.2.1 Alternative Selection Documentation
The Stage 2 sheets of the KYTC ICE Form along with the traffic and safety analysis files are submitted and reviewed with the DES. The ICE Intersection Analysis and Selection Form indicates the intersection control type recommended by the PM and the PDT. The chosen intersection alternative is approved when the DES is approved.
National Academies website https://nap.nationalacademies.org/catalog/27509/guide-for-intersection-control-evaluation . Includes the following files available for download:
- NCHRP Research Report 1087 Guide for Intersection Control Evaluation (2024)
- Capacity Analysis for Planning of Junctions (CAP-X) Tool
- Planning and Preliminary Engineering Applications Guide Tool for Intersection Control Evaluation (PPEAG ICE Tool)
- SSI Score Calculator Tool – Intersection
- SSI Score Calculator Tool – Interchange
- Safety Performance for Intersection Control Evaluation (SPICE)
- Design Flags Calculator
- Life-Cycle Cost Estimating Too (LCCET)FHWA
FHWA’s Intersection Control Evaluation website – Includes a description of ICE and educational materials.
FHWA’s Interchange Comparison Safety Tool
FHWA (2010). Alternative Intersections and Interchanges Informational Report (FHWA-RD-09-060) https://www.fhwa.dot.gov/publications/research/safety/09060/.
FHWA (2021). A Safe System-Based Framework and Analytical Methodology for Assessing Intersections. https://safety.fhwa.dot.gov/intersection/ssi/fhwasa21008.pdf.
Dowling, Richard et al., Planning and Preliminary Engineering Applications Guide to the Highway Capacity Manual, NCHRP Report 825, 2016, http://www.trb.org/NCHRP/Blurbs/174958.aspx
Kittelson & Associates, Inc.; Institute for Transportation Research and Education; Toole Design Group; Accessible Design for the Blind; and ATS Americas. 2020. NCHRP Research Report 948: Guide for Pedestrian and Bicyclist Safety at Alternative and Other Intersections and Interchanges. Transportation Research Board of the National Academies, Washington, DC. https://www.trb.org/Main/Blurbs/181781.aspx.
Virginia DOT’s Innovative Intersections and Interchanges website
KYTC’s Alternative Intersections Map
KYTC’s Intersection Control Evaluation Tips and Tricks
KYTC’s Microsimulation Guidelines
KYTC Traffic Count Reporting System
Life-Cycle Cost Estimation Tool (LCCET) spreadsheet
Article Revision History
This is ICE Version 2.
Access the article revisions here: KYTC ICE Revisions


