
Search for articles or browse our knowledge portal by topic.
Understanding Functional Classification and Context Classification
Recognizing that strict adherence to dimensional design criteria does not automatically result in roads that perform well and are adapted to local contexts, the 7th Edition of A Policy on Geometric Design of Highways and Streets (Green Book) advances a flexible geometric design framework built upon the twin foundations of context classification and functional classification.
Historically, the federal government and state departments of transportation (DOTs) have tied decision making about road design to functional classification. Functional classification categorizes roads based on their position in a transportation network and the type of service (i.e., access or mobility) they provide to motor vehicles. Figure 1 illustrates how the balance of access and mobility varies for different functional classifications. Although functional classification shines a light on how vehicles move through road systems, it does not speak directly to multimodal activity (e.g., pedestrians, micromobility users like bicyclists and people who use scooters). Nor does functional classification characterize a road’s surrounding environment and context beyond labeling it as urban or rural.

Figure 1: Relationship Between Mobility and Access for Different Functional Classifications
Context classification supplements functional classification by using data on development density, land uses, building setbacks, and multimodal users to characterize how roads function within local communities. With this information, appropriate designs can be developed that are responsive to the needs of all transportation modes.
Context classification does not replace functional classification. Under federal law, state DOTs must develop and maintain a statewide functional classification in urban and rural areas. Decisions about Federal-aid program funding eligibility, traffic modeling, reporting of highway statistics, and measurement of highway performance also depend on functional classification. Planners and designers should view functional classification and context classification as complementary.
Knowing a road’s functional classification and context classification can help project teams develop purpose and need statements and identify project objectives. Taken alone, this knowledge is not a sufficient basis for road design. Designers need to have firsthand knowledge of the project site and understand where it fits into the broader transportation system before they can think expansively and holistically about design solutions.
The rest of this article reviews the main features of the functional classification and context classification systems. Through visual examples and rules of thumb, readers will build their intuition about the appearances and operations of roads that have different functional and context classifications and learn how this information can inform the design process.
Transportation planners assign functional classifications based on how well a road conveys traffic through a network, specifically the degree to which a road supports mobility or access. Mobility-oriented roads have few entry or exit points. They minimize travel friction, are highly efficient, and support longer-distance travel speeds. Examples are interstates and freeways. Conversely, a road that prioritizes accessibility gives motorists many opportunities to access adjacent land uses as well as roads positioned lower in the functional classification hierarchy. Roads oriented towards accessibility introduce greater travel friction, are less efficient, and have lower speeds.
Roads that deliver a high degree of mobility are called arterials. These facilities support efficient travel and often have full or partial access control. At the other end of the spectrum, local roads prioritize accessibility. Collectors attempt to balance mobility and accessibility. They collect traffic from local roads and funnel it to arterials or collect traffic from arterials and convey it to local roads.
Table 1 relates functional classification type to road characteristics. The generalizations presented in the table hold true in most cases, but not always. For example, arterials tend to have a high number of travel lanes in urban areas, however, in rural areas they can have as few as two lanes. One category listed in Table 1 that may be less familiar to readers is route spacing. Route spacing is the distance between routes of the same functional classification. For example, the distance between two arterials is typically longer than the distance between two collectors. Additionally, distances between collectors is greater than distances between local streets. Spacing is generally more consistent in urban areas than in rural areas and is tied to the level and density of development. An often-cited rule of thumb is that minor arterial streets in urban cores should be 1/8 – 1/2 mile apart. In suburban areas, spacing of 2 – 3 miles is more appropriate.
| Table 1: Characteristics of Functional Classification Types | |||
|---|---|---|---|
| Arterials | Collectors | Local Roads | |
| Travel Efficiency | ⬤ | ⬤ | ⬤ |
| Speed Limit | ⬤ | ⬤ | ⬤ |
| ⬤ | |||
| Route Spacing | ⬤ | ⬤ | ⬤ |
| Access Points | ⬤ | ⬤ | ⬤ |
| AADT and VMT | ⬤ | ⬤ | ⬤ |
| Travel Lanes | ⬤ | ⬤ | ⬤ |
| ⬤ = High | ⬤ = Moderate | ⬤ = Low | |
Arterials, collectors, and local roads are further divided into sub-categories based on facility characteristics and location (urban or rural). The starting point for differentiating between urban and rural areas is US Census Bureau maps. The US Census Bureau defines urban areas as developed areas with at least 2,000 housing units or a population ≥ 5,000. FHWA stratifies urban areas into three categories — urban, small urban, and urbanized (Table 2). In general, Federal-aid funding is available for (1) urban roads classified as urban minor collectors or above and (2) rural roads classified as rural major collectors or above.
Under federal law, state DOTs, in collaboration with their local partners, can adjust urban area boundaries outward for transportation planning purposes. Updated boundaries must include the entire area originally defined by the US Census Bureau as urban. An agency cannot arbitrarily shrink urban area boundaries so that an urban area footprint is smaller than defined in US Census Bureau maps.
| Table 2: FHWA Urban Area Definitions | ||
|---|---|---|
| Area Type | Population Range | Urban Area Boundary Adjustments Allowed? |
| Urban Area |
≥ 5,000 |
Yes |
| Small Urban Area | <5,000-49,999 | Yes |
| Urbanized Area |
≥ 50,000 |
Yes |
| *Source: FHWA (2023) | ||
KYTC’s Division of Planning establishes, maintains, and updates functional classifications. PL-503.5, Planning Guidance Manual describes the Cabinet’s procedures for managing the functional classification system. With the addition of context classification, designers will now be able to rely on functional classifications — and context classifications — as a starting point to brainstorm project design solutions.
Table 3 synthesizes two tables from FHWA’s Highway Functional Classification Concepts, Criteria and Procedures (2023). It provides information on roadway geometric characteristics and traffic characteristics for roads of different functional classifications. Mileage extents listed in the last two rows of Table 3 are for rural states (Kentucky is a rural state). Tables 4 – 7 describe features of roads with different functional classifications and contain images of each road environment. These images can help planners and designers establish visual frames of reference for different functional classifications. Examples are drawn from KYTC’s functional classification maps, which are available for download on the Division of Planning website. Descriptions are based on the Green Book and FHWA (2023).
| Table 3: Geometric Features and Traffic Characteristics of Functional Classifications | |||||||
|---|---|---|---|---|---|---|---|
| Arterials | Collectors | ||||||
| Interstate | Other Freeways & Expressways | Other Principal Arterial | Minor Arterial | Major collector | Minor Collector | Local | |
| Lane Width | 12 ft | 11 - 12 ft | 11 - 12 ft | 10 - 12 ft | 10 - 12 ft | 10 - 11 ft | 8 - 10 ft |
| Inside Shoulder Width | 4 - 12 ft | 0 - 6 ft | 0 ft | 0 ft | 0 ft | 0 ft | 0 ft |
| Outside Shoulder Width | 10 - 12 ft | 8 - 12 ft | 8 - 12 ft | 4 - 8 ft | 1 - 6 ft | 1 - 4 ft | 0 - 2 ft |
| AADT - Rural | 12,000 - 34,000 | 4,000 - 18,500 | 2,000 - 8,500 | 1,500 - 6,000 | 300 - 2,600 | 150 - 1,110 | 15 - 400 |
| AADT - Urban | 35,000 - 129,000 | 13,000 - 55,000 | 7,000 - 27,000 | 3,000 - 14,000 | 1,100 - 6,300 | 1,100 - 6,300 | 80 - 700 |
| Divided/ Undivided | Divided | Undivided or Divided | Undivided or Divided | Divided | Divided | Divided | Divided |
| Access Control | Full | Partial or Full | Partial or Uncontrolled | Uncontrolled | Uncontrolled | Uncontrolled | Uncontrolled |
| Rural System - Mileage Extent | 1 - 3% | 0 - 2% | 2 - 6% | 2 - 6% | 8 - 19% | 3 - 15% | 62 - 74% |
| Urban System - Mileage Extent | 1 - 3% | 0 - 2% | 4 - 9% | 7 - 14% | 3 - 16% | 3 - 16% | 62 - 75% |
| Source: FHWA (2023). Note: These are generalized characteristics (i.e., rules of thumb). In some cases, roads have geometric features that are not consistent with characteristics specified in the table for its functional classification. | |||||||
| Table 4: Characteristics of Arterials — Interstates and Expressways | ||
|---|---|---|
| Road Type | Features | Imagery |
| Interstate |
|
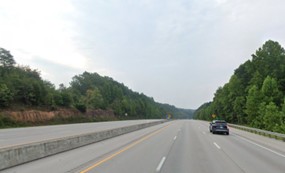 Interstate 75 (Rockcastle County) |
| Other Freeways and Expressways |
|
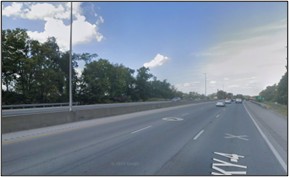 KY 4 New Circle Road (Fayette County) |
| Table 5: Characteristics of Major and Minor Arterials | ||
|---|---|---|
| Road Type | Features | Imagery |
| Urban Principal Arterial |
|
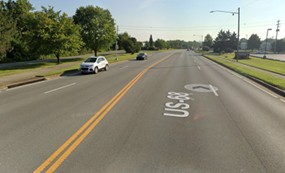 US 68 (Warren County) |
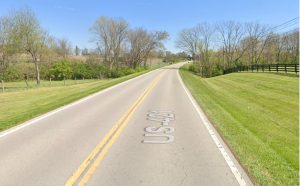
| Rural Principal Arterial |
|
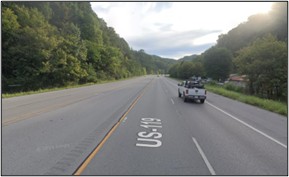 US 119 (Pike County) |
| Urban Minor Arterial |
|
 US 25 (Kenton County) |
| Rural Minor Arterial |
|
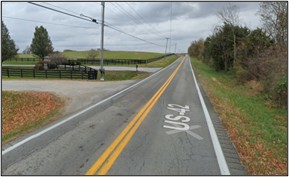 US 42 (Oldham County) |
| Table 6: Characteristics of Major and Minor Collectors | ||
|---|---|---|
| Road Type | Features | Imagery |
| Urban Major Collector |
|
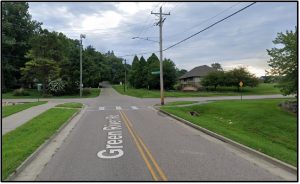 Green River Rd. (Henderson County) |
| Rural Major Collector |
|
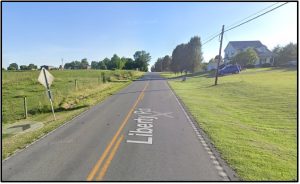 KY 206 (Adair County) |
| Urban Minor Collector |
|
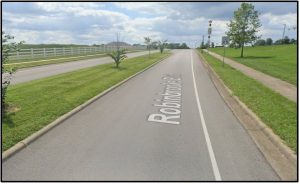 Robinbrooke Blvd. (Hardin County) |
| Rural Minor Collector |
|
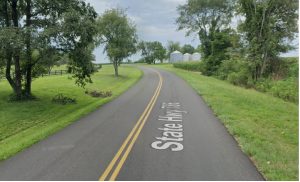 KY 786 (McCracken County) |
| Table 7: Characteristics of Urban and Rural Local Roads | ||
|---|---|---|
| Road Type | Features | Imagery |
| Urban Local Road |
|
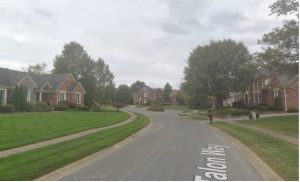
Talon Way (Jefferson County) |
| Rural Local Road |
|
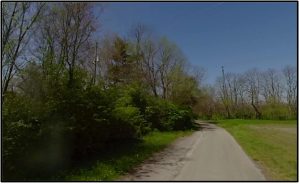
Old Deadplain Rd. (Scott County) |
Functional classification does not explicitly address how a road should fit into the surrounding community or the needs of non-motorized users (e.g., pedestrians, micromobility users). This is where context classification steps in. The goal of context classification is to give designers baseline information about a road’s environmental context, functionality, and user needs. With this knowledge, designers can understand the roles roads play within their communities, their relationship to broader transportation networks, and how the needs of different users should be prioritized.
The context classification system outlined in the Green Book and NCHRP Report 1022 defines contexts based on development density, land uses, and building setbacks. Roads are assigned to one of five contexts — rural, rural town, suburban, urban, and urban core. Table 8 summarizes the primary characteristics of each context and provides accompanying visuals, while Table 9 compares the features of contexts.
| Table 8: Road Context Characteristics | ||
|---|---|---|
| Road Type | Features | Imagery |
| Rural |
|
 US 421, Leestown Road (Woodford, Co.) |
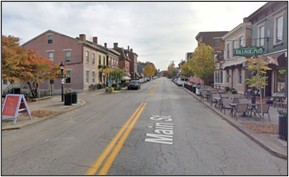
| Rural Town |
|
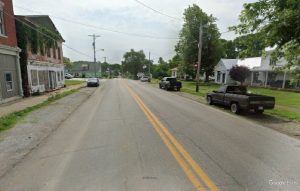
US 460, Main Street (Bourbon, Co.) |
| Suburban |
|
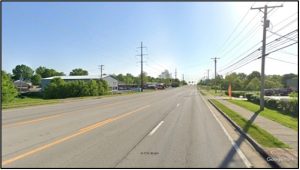 US 60, Shelbyville Rd. (Franklin Co.) |
| Urban |
|
 KY 695, Main St., Hopkinsville |
| Urban Core |
|
 US 25, E Vine St., Lexington |
| Table 9: Comparison of Context Classifications | |||||
|---|---|---|---|---|---|
| Rural | Rural Town | Suburban | Urban | Urban Core | |
| Development Density | ⬤ | ⬤ | ⬤ | ⬤ | ⬤ |
| Speed Expectations | ⬤ | ⬤ | ⬤ | ⬤ | ⬤ |
| Multimodal User Presence | ⬤ | ⬤ | ⬤ | ⬤ | ⬤ |
| Transit Presence | ⬤ | ⬤ | ⬤ | ⬤ | ⬤ |
| ⬤ = High | ⬤ = Moderate | ⬤ = Low | |||
A concept associated with context is transportation expectations. Transportation expectations capture how users expect to move based on an area’s land use and development patterns (i.e., the context). The Green Book does not address transportation expectations. However, understanding each context’s transportation expectations is critical for:
- Determining the anticipated range of users/vehicles
- Evaluating how easily users can move along and across roads and determining the anticipated quality of service for each transportation mode
- Assessing permeability — this entails investigating the connections between adjacent land uses and different transportation modes
- Evaluating alternative routes for each transportation mode and identifying strategies to optimize the movement and distribution of users
- Setting target vehicle speeds in a manner that considers user needs as well as the interactions between user groups
Paying close attention to context and transportation expectations from the beginning of project development lets designers define fundamental project elements, verify that project scopes sufficiently address issues mentioned in the purpose and need statement or project objectives, and confirm that all user needs are addressed.
At a project’s outset, the project development team and designers should use knowledge about the project’s functional and context classifications to build a design framework. The first step in this process is identifying where the project falls within the matrix presented in Table 10. It shows the 17 potential combinations of functional and context classification recognized by KYTC (denoted with checkmarks).
| Table 10: Potential Combinations of Functional and Context Classifications | |||||
|---|---|---|---|---|---|
| Functional Class | Context Class | ||||
| Rural | Rural Town | Suburban | Urban | Urban Core | |
| Local Roads | ✓ | ✓ | ✓ | ✓ | ✓ |
| Collectors | ✓ | ✓ | ✓ | ✓ | ✓ |
| Arterials | ✓ | ✓ | ✓ | ✓ | ✓ |
| Freeways and Above | ✓ | ✓ | |||
| Source: Modified from the Green Book by KYTC | |||||
Once the current functional and context classifications are identified, the project team and designers need to look at whether future development has the potential to alter the context and determine whether this should influence the design. At this point designers can begin establishing design criteria that align with the facility type. In addition to the Green Book and the Highway Design Guidance Manual, several resources can guide this process:
- The FHWA (2023) report on function classification has tables (Table 3-5 and Table 3-6) that list baseline geometric characteristics for roads of different functional classifications.
- Table 10 summarizes transportation expectations associated with each context. Used in combination with information about context characteristics and demand volumes for each transportation mode, designers can pinpoint potential design solutions that strike an appropriate balance among user needs.
- The Human Factors Guidelines Database lets users search for design guidelines that address issues related to human factors based on functional classification, context classification, project type, and keyword. Designers can use this resource to identify design strategies tailored to the user mix and critical safety issues.
- The FHWA’s Proven Safety Countermeasures Filter Tool and Keyword Search lets users search for and identify safety countermeasures based on several criteria. Countermeasures are grouped into five categories — Speed Management, Pedestrian/Bicyclist, Roadway Departure, Intersections, and Crosscutting.
Hover over Table 11 and scroll down to view more information.
| Table 11: Transportation Expectations for Each Context | |||||
|---|---|---|---|---|---|
| Transportation Expectations | Context | ||||
| Rural | Rural Town | Suburban | Urban | Urban Core | |
| Users / Vehicles |
|
|
|
|
|
| Movement |
|
|
|
|
|
| Permeability |
|
|
|
|
|
| Network |
|
|
|
|
|
| Target Vehicle Speed (mph) | 35+ | 25 – 35 | 30 – 45 | 20 – 35 | ≤ 25 |
| Source: NCHRP Report 1022 (After Table 1) | |||||
Design is an iterative process. While the resources listed above provide a good foundation to work through design issues conceptually, firsthand knowledge of the project site acquired through onsite visits is absolutely critical for designers to identify the appropriate blend of design strategies and countermeasures for achieving the project objectives. Designers need to leverage their conceptual and theoretical knowledge of design and their observations of the project site to progressively refine the project design. No single design type or solution applies to an entire functional or context classification, so it is important for designers to always remember that conceptual knowledge is just a starting point.
For example, two roads undergoing reconstruction may have the same functional and context classifications, leading designers to propose similar design concepts early in project development. Becoming wedded to these solutions — largely grounded in conceptual knowledge — is a mistake, however. It is quite possible that local circumstances, which can only be understood through firsthand observation, could ultimately require different solutions.
Leveraging knowledge of functional and context classification from the earliest stages of project development and design helps designers be proactive in how they deal with safety and fosters application of the Safe System Approach. Being aware of a road’s functional and context classification helps designers anticipate what types of user errors are most likely to occur — based on the historical performances of similar facilities — as well as the most common crash types. With this knowledge in hand, designers are better prepared to look at project sites and figure out effective and flexible design strategies for building multiple layers of protection into a facility so that safety and efficient mobility are balanced for all users.
- KTC produced a video the explores the benefits of context classification for decision making during planning and design and reviews how context classification complements functional classification.
FHWA (2023) — Highway Functional Classification Concepts, Criteria and Procedures 2023 Edition
-
- This publication offers a comprehensive overview of functional classification, including a discussion of road types, methods for performing functional classification, and implications for design.
NCHRP Report 1022 — Context Classification Application: A Guide
-
- This report includes overviews of each context, discusses the scalability of context classification (i.e., applications from the project level through the network level), and offers several examples of how context classification can be applied by agencies.
Watch our video to view more information about Functional Classification and Context Classification