Search for articles or browse our knowledge portal by topic.
Utility Depiction on Plans
KYTC’s Digital Project Delivery initiative is “focused delivery of projects utilizing digital data”. This initiative follows ASCE guidance as it pertains to collection of digital data for utilities. Recently, ASCE released a new guidance document: ASCE 38-33, Standard Guideline for Investigating and Documenting Existing Utilities.

Depicting accurate utility location on highway plans is critical to avoiding unnecessary costs and delays; doing so also enhances safety during construction.
The data used for depicting utility data on highway plans is collected in the field by various survey methods. This data includes:
- Horizontal position (x and y)
- Vertical position (depth, z) when appropriate
- Material composition
- Size
- Other pertinent data
This information must be displayed on project mapping that will be used to develop plans. Each feature is assigned a data collector code (aka, feature code or survey code) as it is surveyed in the field. A list of data collector codes can be found on the KYTC Survey Self Help site at https://transportation.ky.gov/Highway-Design/Pages/Survey-Self-Help.aspx. KYTC’s CAD software, OpenRoads Designer (ORD), will read this data collector code and assign a definition to each feature that will control how it is displayed in the project mapping. KYTC feature definitions show each utility with a different line style so that they can be distinguished from each other in the mapping.
Subsurface Utility Engineering (SUE) uses various techniques to locate and map underground utilities. SUE criteria specify different levels of investigation for these utilities. For more information see HKP article Subsurface Utility Engineering (SUE) and the video below which describes the SUE levels.
KYTC recently updated its CADD Standards so that data collector codes used for subsurface utilities display in the project mapping in a manner that identifies the level of investigation (A,B,C or D) that these utilities have undergone. The CADD Standards have also been updated to provide display filters that show utilities according to their APWA Uniform Color Code. Pen tables have been created to allow this same functionality on printed plans as well.
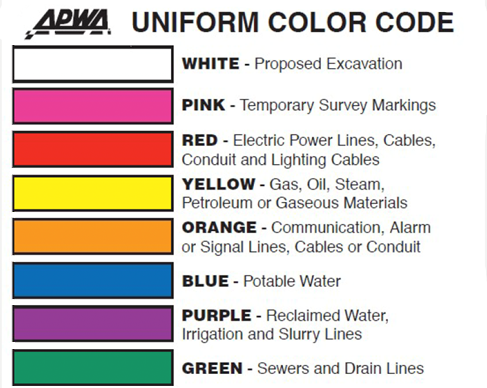
Figure 1: APWA Color Code
The video below gives a brief overview of feature codes, display filters and the pen table discussed above.
Using the features discussed in the previous section, designers have multiple options for displaying utility features on plan sheets, cross sections and in screen displays.
When the pen table is used, plan sheet printouts will display utility features with their APWA color code. In the figure below, water lines have been printed blue as to match their APWA color code.
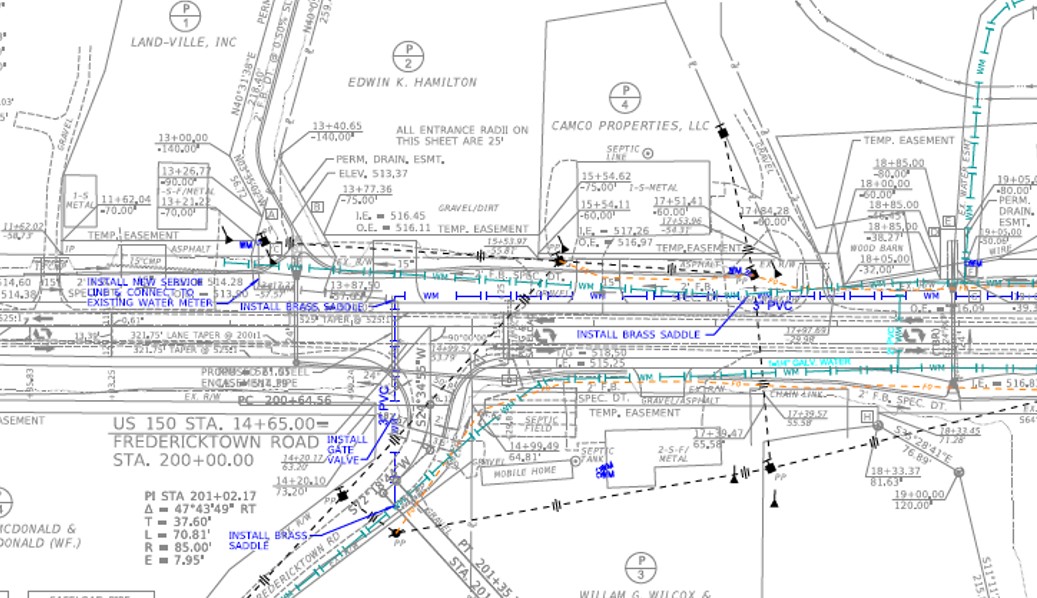
Figure 2: Printout With Utility Pen Table
Similarly, using the display filter will display the features on screen in ORD as shown below. Note the SUE level is also displayed in the labels.
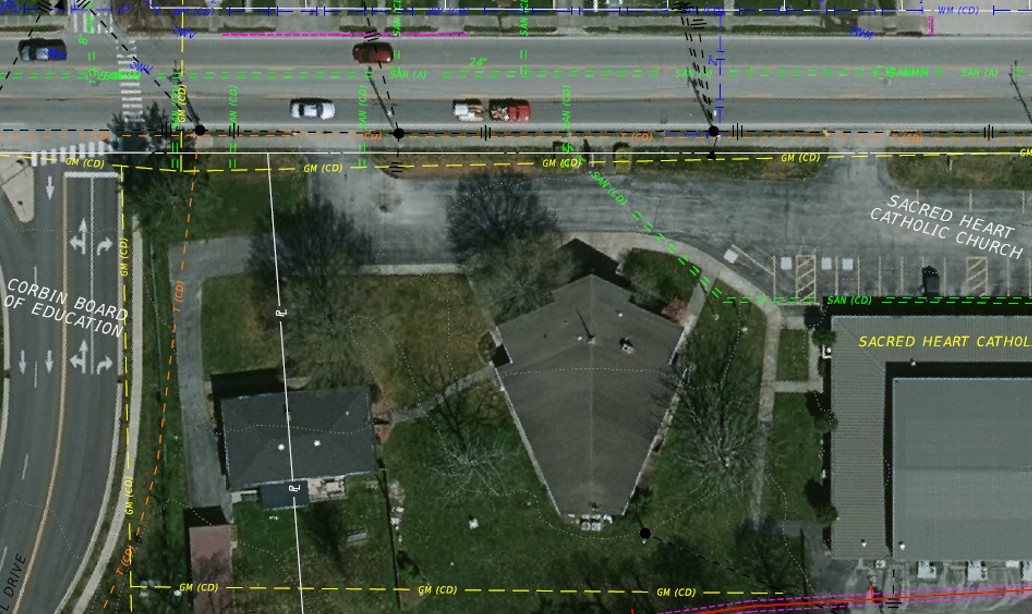
Figure 3: Utility Filter Screen Display
There have also been updates to how utility features are displayed in cross section. The figure below shows a SUE Level C/D displayed on cross section. SUE Levels C and D do not include elevation information; therefore the utility is shown as a vertical line flagging the horizontal position of the utility on the cross section.
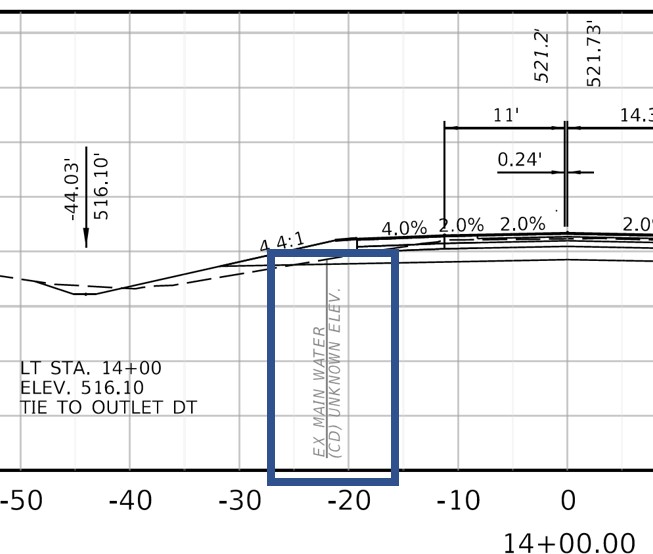
Figure 4: SUE Level C/D On Cross Section
For a Quality Level B location, the utility is shown on the cross section at its approximate elevation (see Figure 5).
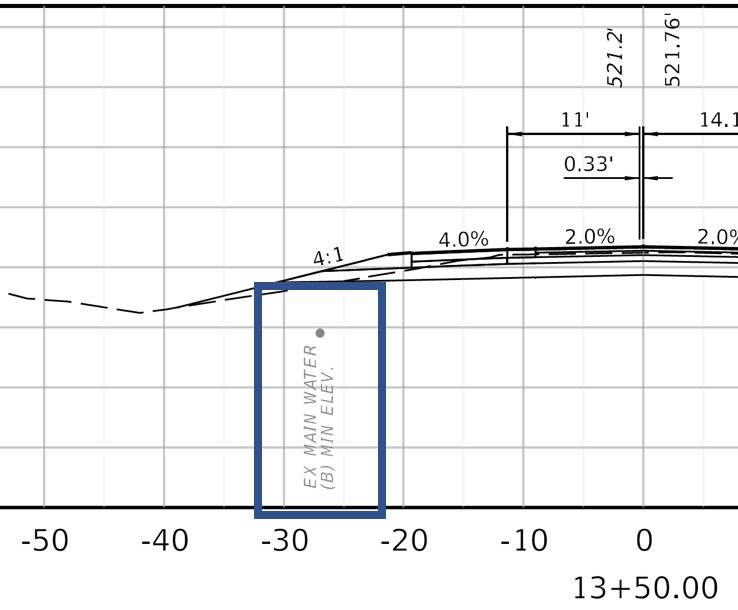
Figure 5: SUE Level B On Cross Section
As shown in Figure 6, quality Level A utilities are shown with the elevation noted.
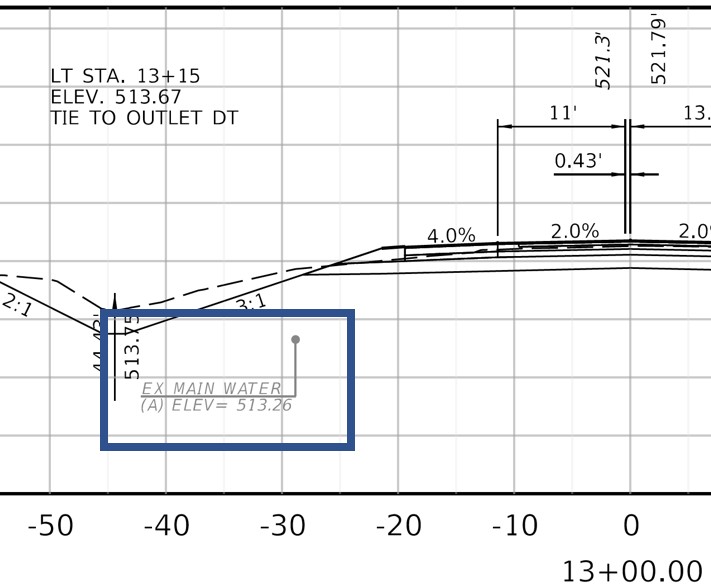
Figure 6: SUE Level A On Cross Section
For a brief overview of some of these features, see the video below.
